Forum
Forum OPRR
OPRR Finance
 Specials
 On-chain Eco
 Entry
Entry
 Podcasts
 Activities

Sort out 6 practical on-chain indicators to determine the trend of BTC
Source: Biteye
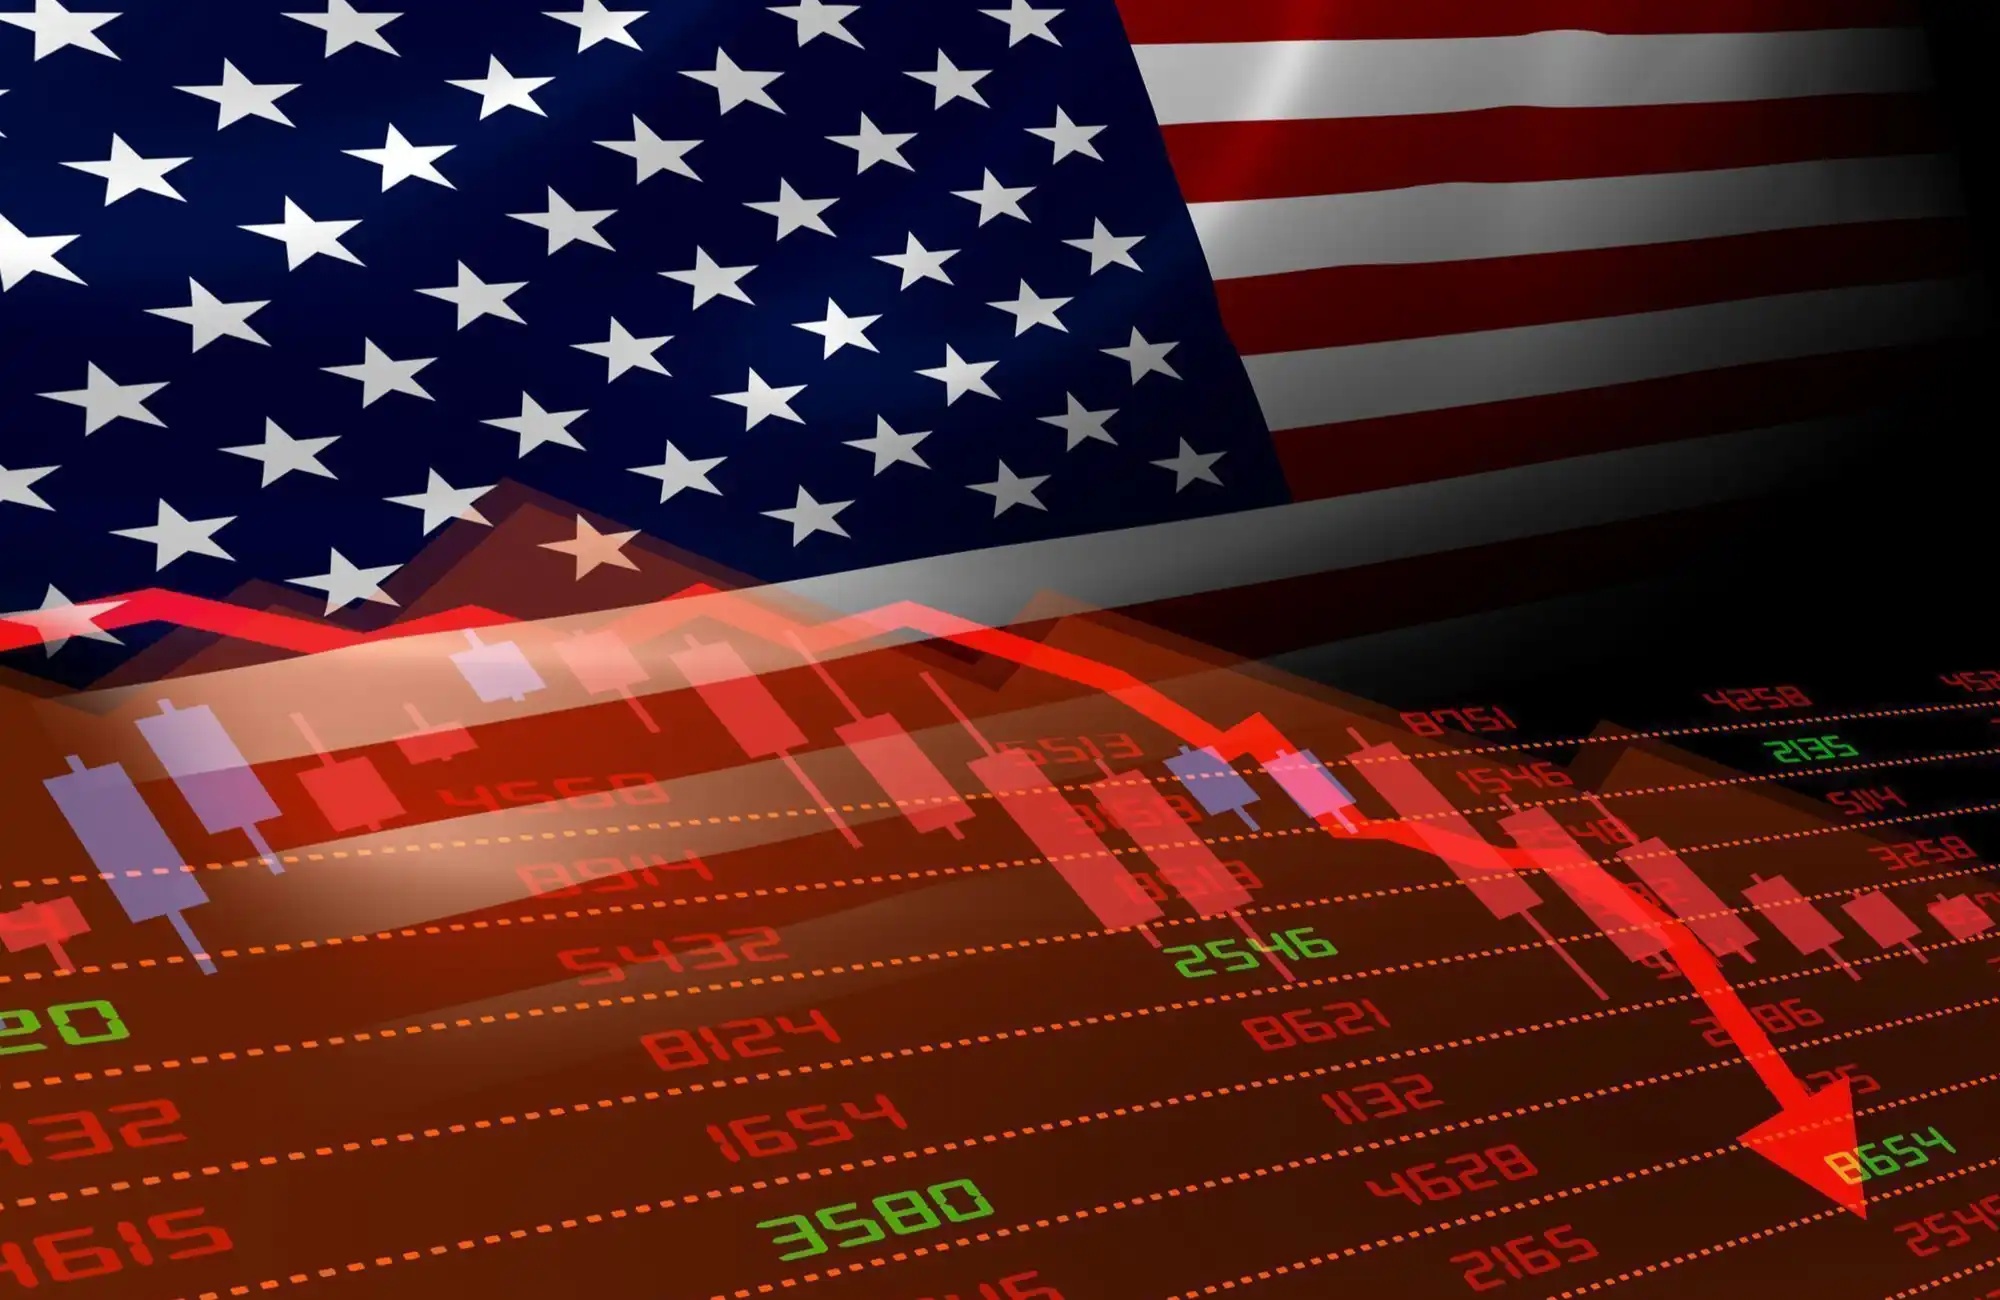
For cryptocurrency investors, there are two eternal pursuits: 1) selling at the top; 2) buying at the bottom. In addition to assessing the value of a project, what can we use to determine the top/bottom of BTC in the current bullish market sentiment?
This issue of Biteye brings you six highly informative explanations of practical BTC on-chain indicators. You can refer to them to judge the trend of BTC~
1. The first indicator to be introduced is: MVRV: Market Value to Realized Value Ratio
MVRV is a ratio calculated by dividing the total market value of BTC by the last active price of BTC. This ratio represents the profit situation of BTC holders.
When MVRV exceeds 3.5, it usually indicates that the market has reached its peak; because when MVRV is too high, it means that the holders have made significant profits, and they tend to sell at this time;
2、When MVRV is below 1, it usually indicates that the market has reached the bottom
Most investors are in a state of loss, and their willingness to hold is greater than their willingness to sell, which means that the number of sellers in the market is decreasing, thus increasing the probability of subsequent price increases. Currently, the indicator is 1.658, which is not in the long-term bottom or top range.

3. The second thing to introduce is the Bitcoin Ahr999 Index
This index is used to guide when it is the bottom of BTC and when it is suitable for regular investment. Essentially, it is a timing indicator.
Ahr999 = (Bitcoin price/200 daily investment cost) * (Bitcoin price/index growth estimate)
This indicator implies the rate of return of Bitcoin dollar-cost averaging and the deviation between Bitcoin price and expected valuation, so the lower it is, the more undervalued BTC price is.
4、具体使用方法:
translates to
4. Specific Usage Method:
1) When AHR999<0.45, the indicator suggests a buy signal at this point;
2) When AHR999 is between 0.45-1.2, this indicator will suggest regular investment;
3) When AHR999 is greater than 1.2, this indicator does not provide operational recommendations.
The current value of this indicator is 0.66, which suggests a recommended investment range for regular purchases.

5、The third indicator to be introduced is Bitcoin Dominance
The market capitalization dominance of Bitcoin refers to the percentage of Bitcoin's market capitalization in the entire digital currency market.
BTC's market share has the characteristic of being discovered for its value in the early stages of a bull market, during which its market share will increase. However, in the later stages of a bull market, funds flow out to Ethereum and altcoins, causing its market share to decrease.
6/12 From the historical performance of BTC market share, it rose from 50.7% to 60.5% during the 2018 bull market, and reached a peak of 69% during the bull market in 2022, during which BTC was in a strong upward trend.
When the market share declines, it is mainly driven by the rise of counterfeit products, and the big players may remain stagnant or rise slowly. The market share at the bottom of the previous bear market reached 38%, which can be used as a reference for future bottoms.
The current market share of BTC is steadily increasing, accounting for 53.04%.

7. The fourth one to introduce is SOPR: Spent Output Profit Ratio
The calculation method is Price sold/Price paid, which means the selling price of the asset on the day divided by the buying price of the asset. This indicator is also used to reflect the overall profit and loss of the market and the market sentiment.
When the SOPR value continues to rise and is greater than 1, it means that the market is continuing to rise; when the SOPR value continues to decline and is less than 1, it means that the market is continuing to fall;
8. As shown in the figure below, it can be seen that when the SORP value drops sharply, it means that people in the market are selling at a loss. The more people sell, the closer the market is to the bottom. Therefore, when SOPR drops significantly, it means that a large number of sellers have already sold and left, so the possibility of reaching the bottom is relatively high at this time.
The current indicator shows a continuous upward trend with a value of 1.016, indicating that there are more continuous buying situations at present.

9. The fifth one to introduce is the Bitcoin Rainbow Chart Index (The Rainbow Chart).
The rainbow chart has nine color bands, among which the most important red and blue represent the bubble phase and the BTC big sell-off phase respectively, indicating the top and bottom of the market.


Welcome to join the official BlockBeats community:
Telegram Subscription Group: https://t.me/theblockbeats
Telegram Discussion Group: https://t.me/BlockBeats_App
Official Twitter Account: https://twitter.com/BlockBeatsAsia