Forum
Forum Finance
 Specials
 On-chain Eco
 Entry
Entry
 Podcasts
 Activities
 OPRR
OPRR

On-chain Data School (Part 3): Have the Whales Who Engaged in Bottom Feeding Taken Their Profits?

Original Title: "On-Chain Data School (Part 3): Have the Bottom Fishing Whales Taken Their Profits?"
Original Author: Mr. Whaleberg, On-Chain Data Analyst
This article is the 3rd part of the On-Chain Data School series, consisting of 10 parts in total. It will take you through an exploration of on-chain data analysis step by step. Interested readers are welcome to follow this series.
Related Reading: "On-Chain Data School (Part 2): The Ever-Profitable Hodlers, What Was Their Cost Basis for Buying BTC?"
TLDR
- This article will focus on introducing the on-chain metric of Realized Profit
- Realized Profit shows the daily amount of profit-taking in the market
- Massive Realized Profit is usually only caused by low-cost chip holders
- Market tops are typically associated with significant Realized Profit
Introduction to Realized Profit & Realized Loss
Realized Profit, translated as "已实现利润" in Chinese, is calculated based on the price of each BTC at the time of its last transfer compared to the price at the time of its previous transfer. It calculates how much BTC is profitably realized each day. By summing up the total profit from these BTC realizations, the daily Realized Profit can be obtained.
Of course, if the price at the last transfer is lower than the price at the previous transfer, it will be counted as Realized Loss.
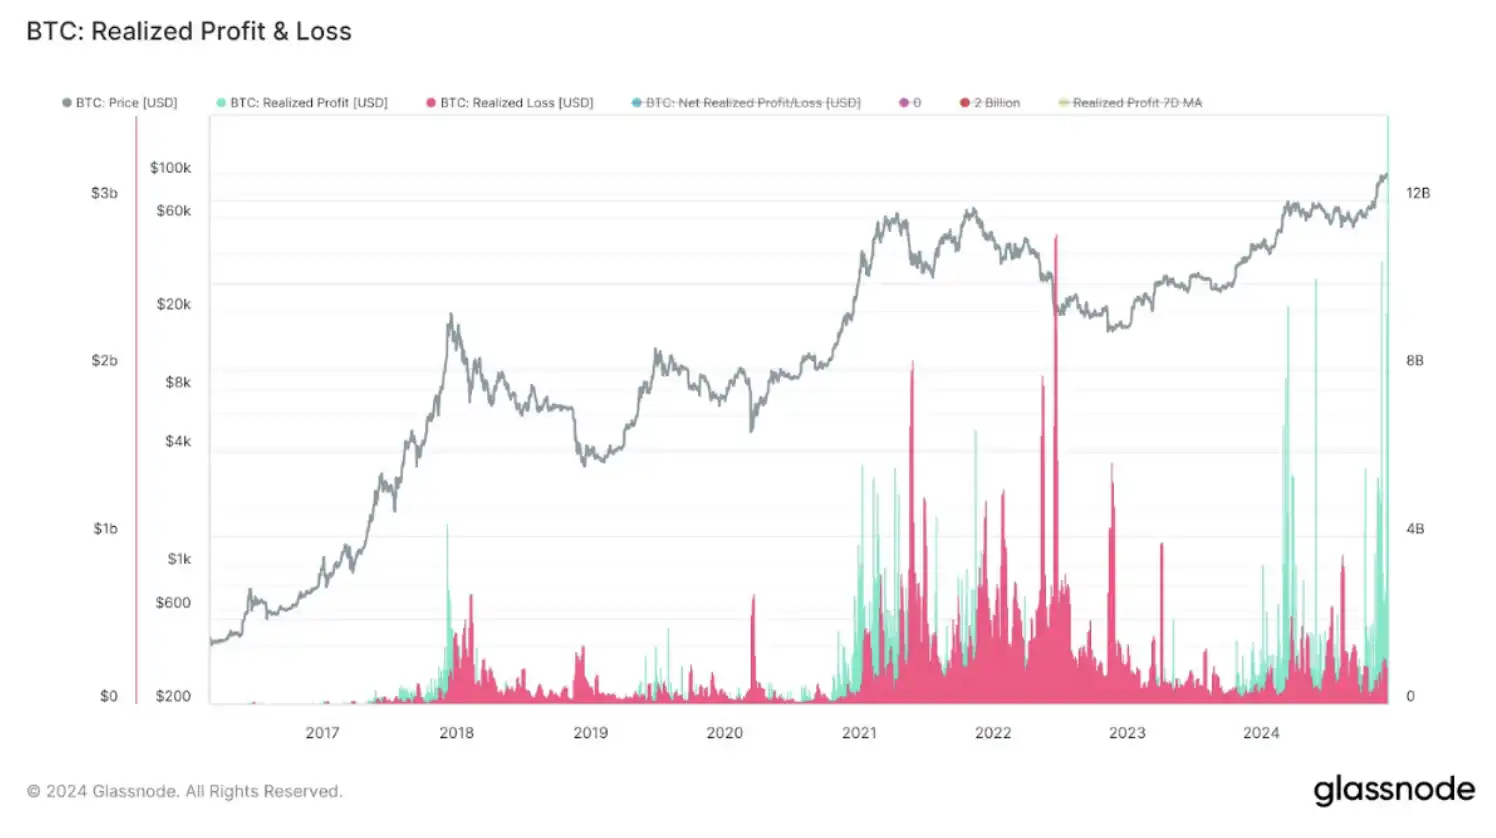
Realized Profit & Realized Loss Chart
Massive Realized Profit is Usually Only Caused by Low-Cost Chip Holders
As shown in the figure below: Due to the high-cost chip holders, their profit margin is not large. Therefore, when they sell, the **Realized Profit** that can be generated is not much.
So, when we see a huge amount of Realized Profit, it usually means that holders of low-cost chips are selling BTC.
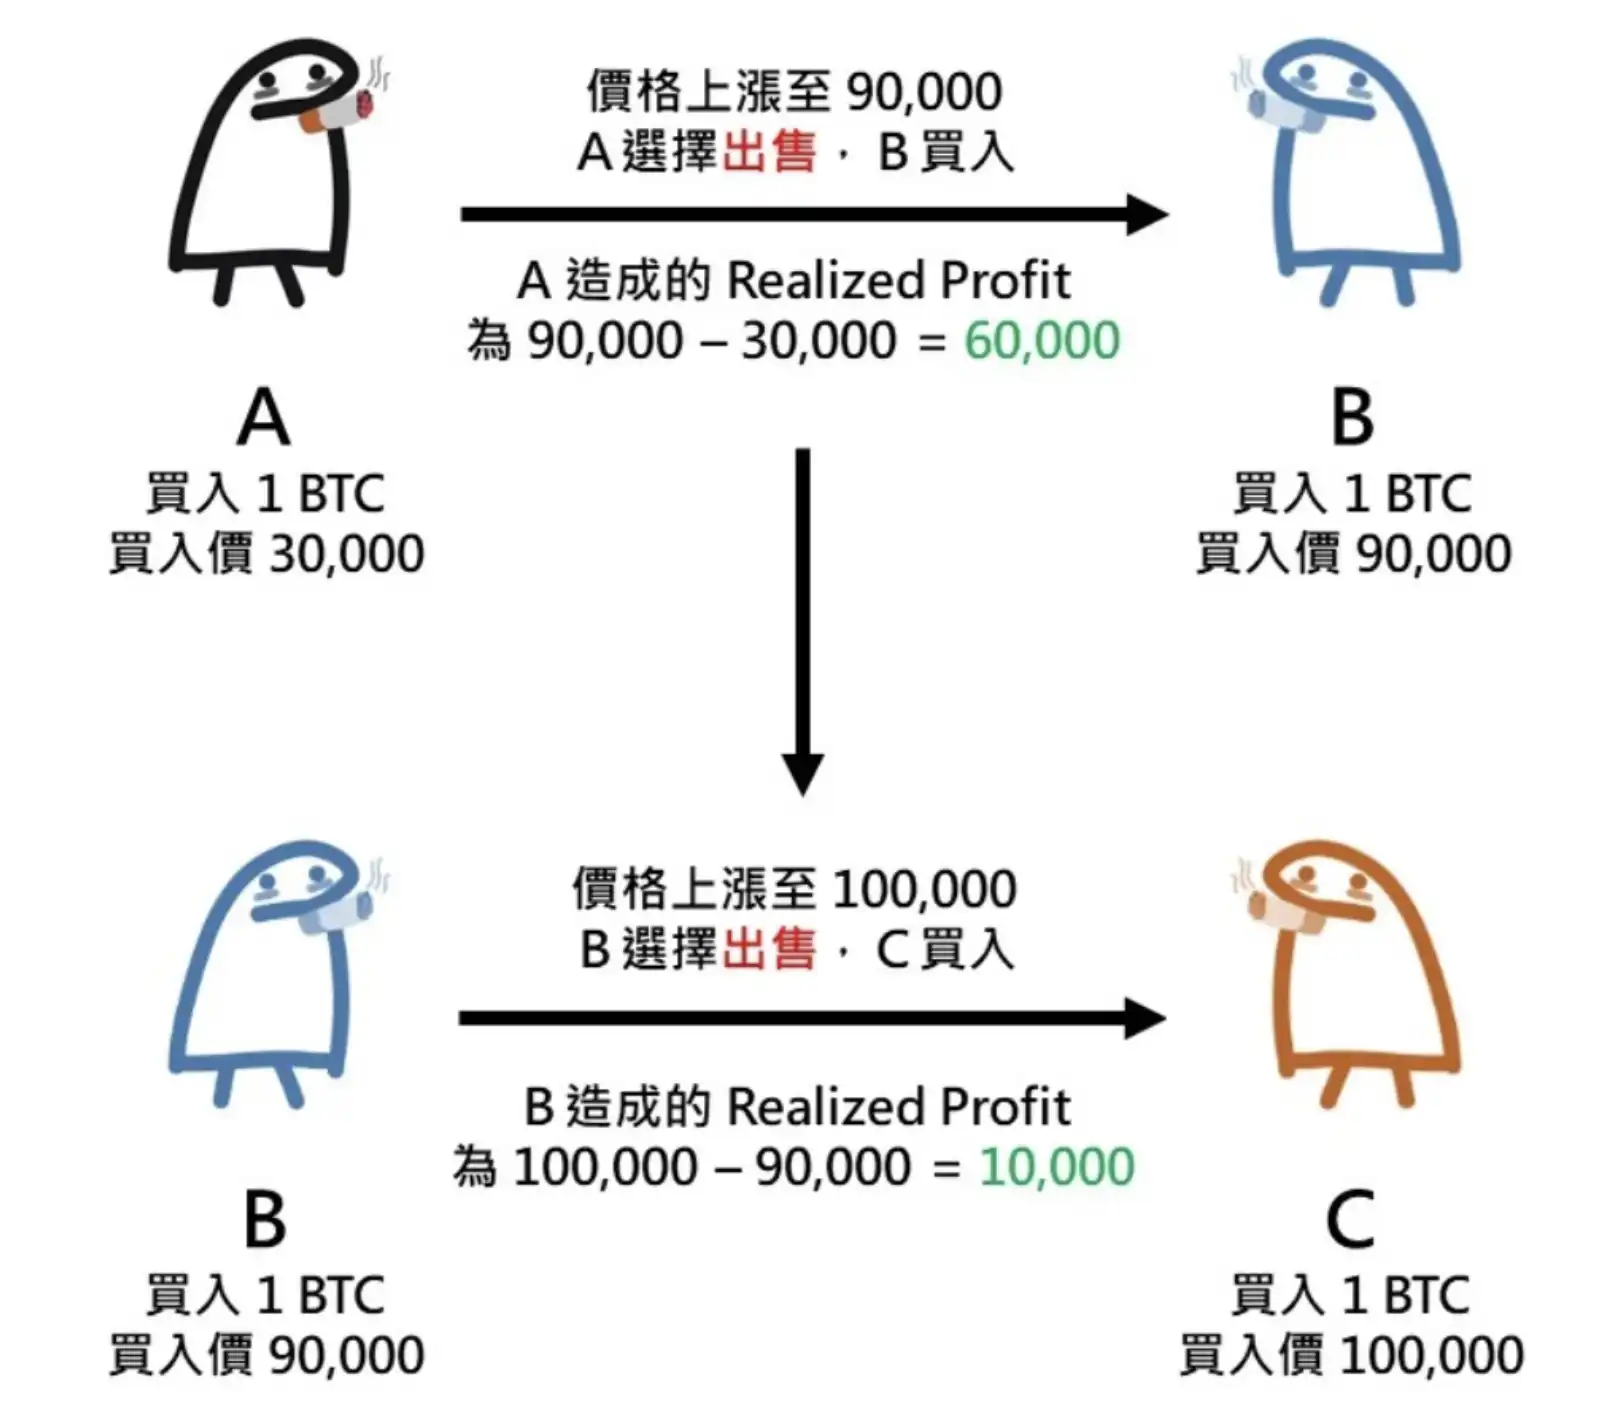
Realized Profit Calculation Diagram
Tops are usually accompanied by a large volume of Realized Profit
When a large number of low-cost chip holders sell their BTC, we will see clustered high volume realized profits on the chart.
At this point, since the remaining participants in the market are high-cost buyers, the market price is close to their cost price. Once sentiment slightly shifts, it is easier to make them panic sell, leading to a cascading price drop, forming a top.
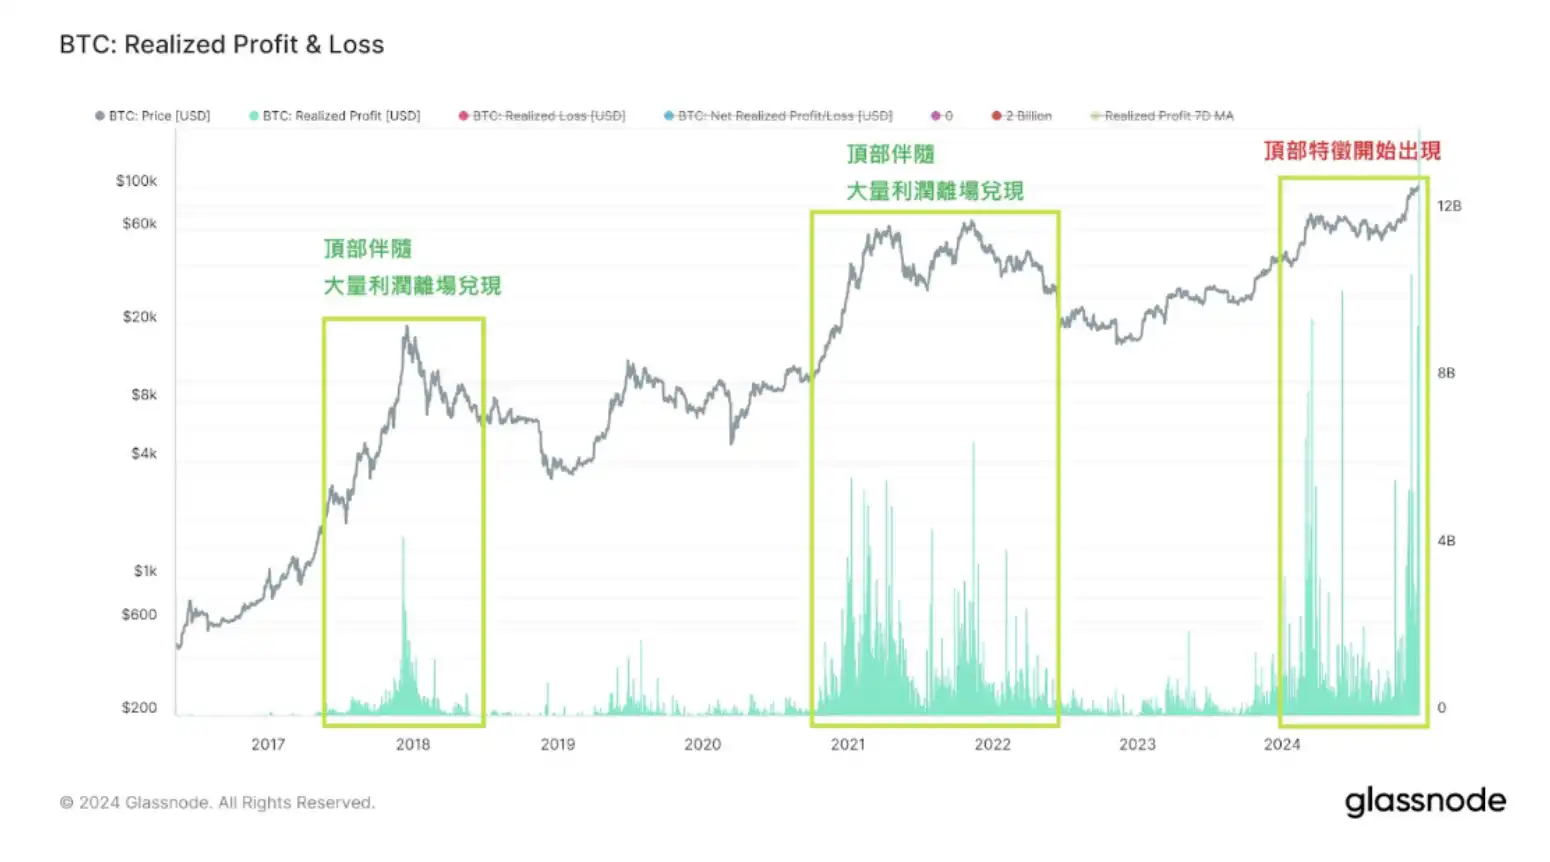
Tops are usually accompanied by a large volume of Realized Profit
Welcome to join the official BlockBeats community:
Telegram Subscription Group: https://t.me/theblockbeats
Telegram Discussion Group: https://t.me/BlockBeats_App
Official Twitter Account: https://twitter.com/BlockBeatsAsia