Forum
Forum Finance
 Specials
 On-chain Eco
 Entry
Entry
 Podcasts
 Activities
 OPRR
OPRR

From the on-chain data perspective, explore the cyclical nature of BTC gradually disappearing

Original Article Title: "Exploring the Gradual Disappearance Cycle of BTC from an On-Chain Data Perspective"
Original Article Author: Mr. Berg, On-Chain Data Analyst
The BTC, bearing the name of digital gold, is still young, and the four-year cycle of disappearance is an inevitable path to follow.
Key Points:
· BTC's strong periodicity is inevitably gradually disappearing
· 2021's two tops: a complete failure of the SWORD philosophy
· A first in history: significant changes in the URPD chip structure
· Analysis methods and strategies post-periodic disappearance
The Inevitable Disappearing Periodicity
I believe most people in the crypto community are no strangers to BTC's strong periodicity. Stemming from the design of a halving in production every four years, BTC's price trend appears to correspond perfectly to it.
At the end of 2013, 2017, and 2021, there were three precise periodicity tops, each corresponding perfectly to the four-year cycle, making it a benchmark for countless market participants.
However, from a scientific perspective, relying solely on historical patterns clearly cannot lead to rigorous conclusions.
As the impact of the halving diminishes step by step and market valuation grows, there is currently no viewpoint supporting the four-year cycle theory that can withstand scientific scrutiny.
If periodicity disappears in the future, how should we, as traders, respond?
The Strongest Group: Participants Holding for 1 to 3 Years
In history, there has been a group whose behavior always perfectly aligns with BTC's bull and bear cycles, and that group is the market participants holding for "1 to 3 years."
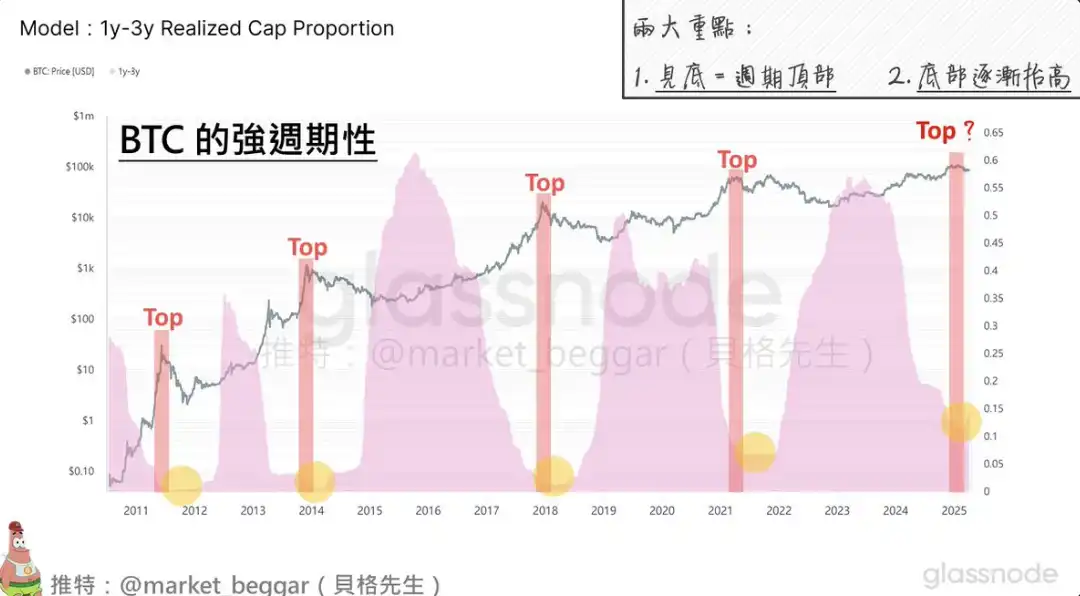
(Chart Description: Percentage of Market Participants Holding for 1-3 Years)
We can clearly see:
· Whenever this percentage hits a bottom, it always corresponds to the cycle's price top
· Whenever this dominance reaches its peak, it always corresponds to the price's cycle bottom.
In simple terms: Whenever the BTC price peaks, they have just sold everything; and whenever the BTC price bottoms out, they have just accumulated a large number of chips.
Which is the cause and which is the effect, currently cannot be answered, but obviously the appearance of the bull-bear cycle is closely related to them.
In this chart, three points are worth noting:
1. After each cycle, the lowest value of this dominance is increasing year by year, and the reason behind it is not difficult to guess: more and more participants choose to hold BTC long-term.
2. Currently, the dominance of this group is beginning to shift towards "increase," echoing the logic of my bearish view on BTC since the end of last year. For more details, please refer to my previous post (there are follow-up updates in the comments section):
On-chain data in-depth analysis: Perhaps you need to be prepared to sell at the top at any time. https://x.com/market_beggar/status/1878653495311839475
3. It can be reasonably inferred that in the future, the bottom value of this dominance will only grow larger along the way, from obscurity to listing on a U.S. ETF, competing with gold, as BTC gradually enters the public eye, more people willing to hold BTC will also increase.
Two Peaks in 2021: The Complete Failure of the Carving Boat Seekers
Previously, I have written several articles specifically discussing the double top of 2021.
Among them, in the article "Revisiting the Double Top of 2021: What is 'Future Data Leakage'?" I clearly pointed out the uniqueness of the 2021 double top and elaborated on why you cannot seek a sword by carving a boat.
Article link: https://x.com/market_beggar/status/1891335031177851380
Combining today's theme, I will approach the analysis from another perspective:
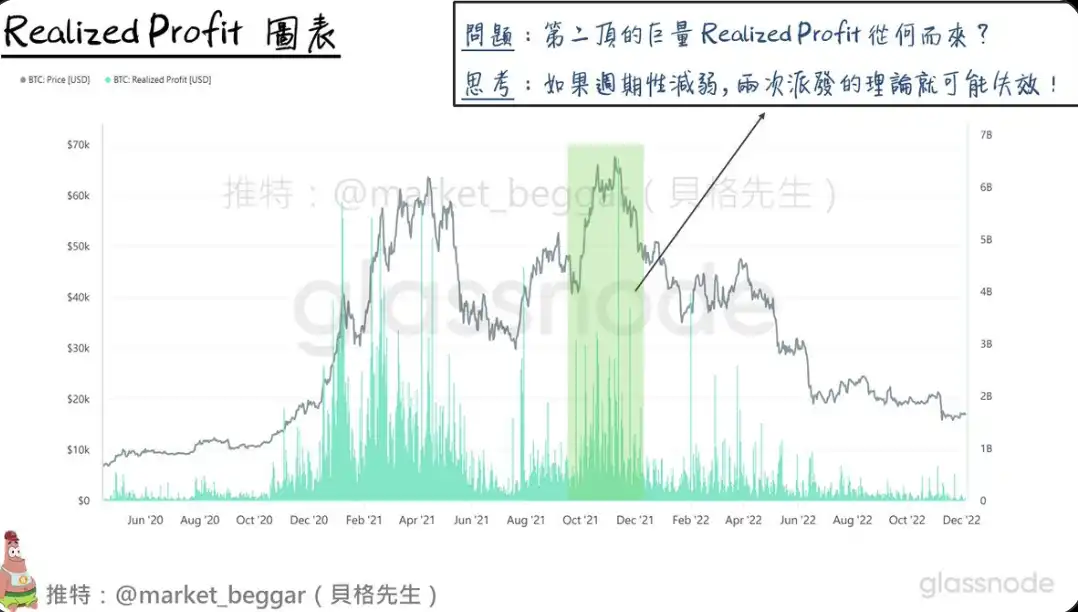
(Chart Description: Realized Profit)
The so-called Realized Profit is based on the on-chain UTXO accounting principle, which calculates the daily profit that has been realized.
In a pinned post of mine, it was also mentioned that whenever centralized, massive Realized Profit appears, it indicates a large amount of low-cost chips being sold off for cashing out, serving as a major warning signal.
For a detailed analysis logic, please refer to the following text:
Top Signal Tracking: Massive Realized Profit Recap https://x.com/market_beggar/status/1882645089786450368
From the perspective of on-chain data, in fact, the cycle had already ended in April 2021 (the first peak) (https://x.com/market_beggar/status/1889878465056481309); however, subsequently, due to various factors, BTC made the second peak in November 2021.
As shown in the above chart, at the time of the second peak, it was also accompanied by a massive Realized Profit. So, the question arises: "Where did this massive Realized Profit come from?"
Combining the first chart, the group with a holding period of 1 to 3 years actually bottomed out in April 2021, so the massive Realized Profit at the second peak can only come from the group that accumulated chips from "May to July 2021."
The point worth pondering is right here:
If cyclical bottoms gradually disappear in the future, will there be more instances of this kind of "brief bottoming" followed by the beginning of a new major uptrend?
As mentioned in my previous articles, past peaks often accompanied two large-scale distributions, and indeed, this cycle also saw the second large-scale distribution in December of last year. But if, with the decreasing volatility in the future, only one distribution is needed to complete BTC's new-style bull-bear cycle transition
It's worth a deep thought.
First in History: Massive Transformation of URPD Chip Structure
Next, let's discuss this topic from the perspective of chip structure.

(Chart Description: Comparison of URPD Chip Structure at Previous Three Cycle Peaks)
You can see: This cycle is the most special one so far.
We say this because:
This is the first time in history that a massive amount of chips has accumulated in the top area of the cycle after the second large-scale distribution.
Previously, I have also written about this topic, detailed views can be seen in the following article:
BTC Chip Analysis: Discussing the Biggest Potential Chip Structure Risk on URPD https://x.com/market_beggar/status/1887430338009567304
Based on this, we may have to admit: BTC is entering a new era.
Analysis Approach & Response Strategy After Cycle Disappearance
If in the future, cycle behavior does indeed continue to weaken as expected,
how should we, as traders, interpret the market situation?
First, the conclusion: Never be dogmatic, and analyze using deductive logic
In BTC's young lifespan, the sample size is severely insufficient,
which has caused numerous dogmatic theories to be overturned one after another.
Season of Altcoins, New Year Pump, Pump n days after Halving... the list is endless,
not to mention all the indicators that were knocked out in 2021.
Therefore, to overcome the problem of insufficient sample size, we must ensure the presence of logic as much as possible
in the research process.

Let's take an example: AVIV Heatmap.
AVIV, seen as an optimized version of MVRV,
calculates based on active (rather than completely dormant) chips, excluding the influence of miners.
And AVIV Heatmap is one of the models I personally designed,
utilizing the mean reversion property of AVIV and coloring based on its deviation.
The advantage of this analysis method is that deviation calculation considers the "standard deviation,"
which directly reflects the BTC volatility index.
Therefore, as volatility decreases, the standards for defining extreme values in the AVIV Heatmap will also loosen.
Conclusion
Let's summarize briefly:
1. As the market matures, the disappearance of cyclicity is an inevitable path.
2. Chips held for 1 to 3 years have historically dominated the bull and bear cycles.
3. The double top in 2021 marked the failure of the "seeking a sword in a boat" methodology.
4. There has been a huge change in the chip structure that has never happened before.
5. As a trader, it is essential to ensure logical reasoning in the research process to guarantee the usability of the results.
BTC is still young, moving at an unprecedented pace towards the world's eyes,
and both you and I will be witnesses to this historic feast.
Welcome to join the official BlockBeats community:
Telegram Subscription Group: https://t.me/theblockbeats
Telegram Discussion Group: https://t.me/BlockBeats_App
Official Twitter Account: https://twitter.com/BlockBeatsAsia