Forum
Forum Finance
 Specials
 On-chain Eco
 Entry
Entry
 Podcasts
 Activities
 OPRR
OPRR

Shutdown Over = Market Rebound? Review of US Stock, Gold, and BTC Trends After Each Government Restart

Original Title: "End of Shutdown = Market Rebound? A Complete Analysis of the Performance of US Stocks, Gold, and BTC After Previous Government Reopenings"
Original Author: David, Deep Tide TechFlow
At 5 a.m. Beijing Time on November 13, a 43-day government shutdown crisis, setting a historical record in the United States, is about to come to an end.
The U.S. House of Representatives passed a temporary funding bill by a vote of 222-209 on the evening of November 12 local time, which was then signed by Trump.
Thus, the shutdown deadlock that began on October 1 has come to an end.
During these 43 days, there were widespread flight delays, interruption of food aid programs, and suspension of economic data releases, casting uncertainty over all aspects of the world's largest economy.
As the shutdown ends, how will the market react?
For investors in the cryptocurrency market and traditional financial markets, this is not only the conclusion of a political event but also an observation window on how asset prices respond to the "elimination of uncertainty."
Historical data shows that after past major U.S. government shutdowns, U.S. stocks, gold, and Bitcoin have all displayed different trend characteristics.
This time, as the government reopens and federal funding resumes, which assets may benefit?
If you don't have time to read, the following chart can help you quickly grasp the key points.
There is more detail below to help you learn from history and become a savvy investor.
How Does a Shutdown Actually Impact Investments?
To understand the market's response after the shutdown, first, we need to understand: how does a government shutdown actually affect asset prices?
A government shutdown is by no means simply "a vacation for government employees."
According to the Congressional Budget Office's (CBO) estimates, the 35-day shutdown in 2018-2019 resulted in approximately $3 billion in permanent GDP losses and about $8 billion in delayed temporary economic activity.
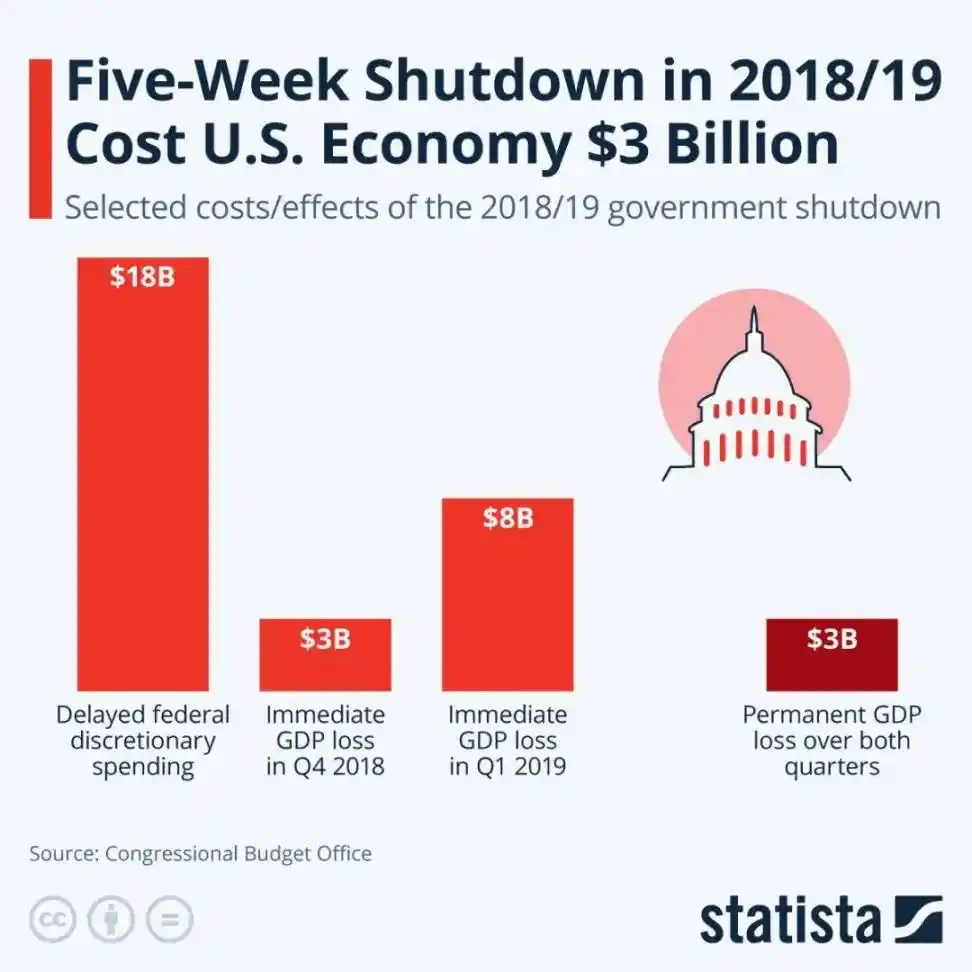
This 43-day shutdown has broken historical records. Although the CBO has not yet released an economic impact assessment of this shutdown, considering its longer duration and wider impact, the economic losses are likely to significantly exceed those of 2018-2019.
Tangible economic activity reduction will be reflected in key indicators such as GDP growth rate, consumption data, and corporate profits.
But more important than the economic loss is the uncertainty itself.
One of the core logics of the financial markets is: Investors abhor uncertainty.
When the future is unpredictable, funds tend to divest high-risk assets (tech stocks, growth stocks), increase holdings of safe-haven assets (gold, U.S. bonds, etc.), reduce leverage, and hold cash to wait and observe.
So, what happens when the shutdown ends? In theory, the end of a shutdown signifies:
Policy certainty returns - At least for the next few months, government funding is secured Economic data resumes publication - Investors regain tools to assess economic fundamentals Fiscal spending restarts - Delayed procurement, wages, benefits payments begin, providing a short-term boost to the economy Risk appetite restores - The worst-case scenario is averted, funds start chasing returns
This usually triggers a "relief rally" because the elimination of uncertainty itself is a positive.
It is worth noting that this kind of rebound may not be long-lasting.
After the shutdown, the market will quickly return to focusing on economic fundamentals; therefore, we believe the impact of the shutdown on the market can be divided into two levels:
· Short-term (1-2 weeks): Emotion recovery due to uncertainty elimination usually favoring risk assets
· Mid-term (1-3 months): Depending on whether economic fundamentals are actually damaged and other macro factors
For the crypto market, there is also a special consideration: the resumption of regulatory agency operations.
Regulatory agencies like the SEC, CFTC, etc., were basically stalled during the shutdown, with approval processes paused and enforcement actions delayed. When the government reopens, how these agencies will "catch up" is also a variable worth watching.
Next, let's look at historical data to see the actual performance of the U.S. stock market, gold, and Bitcoin after several major shutdowns in the past.
U.S. Stock Market Historical Review: There is Always a "Relief Rally" after the Shutdown Ends
Let's focus on three extended government shutdown events that had a significant impact on the market and see how investors responded with real money in the U.S. stock market when the government reopened.
You can see:
1. December 1995 Shutdown (21 Days): On the Eve of the Tech Bubble, Mild Rise
On December 16, 1995, the Clinton administration and the Republican-controlled Congress reached a stalemate over a balanced budget plan, leading to a government shutdown.
Market Performance:
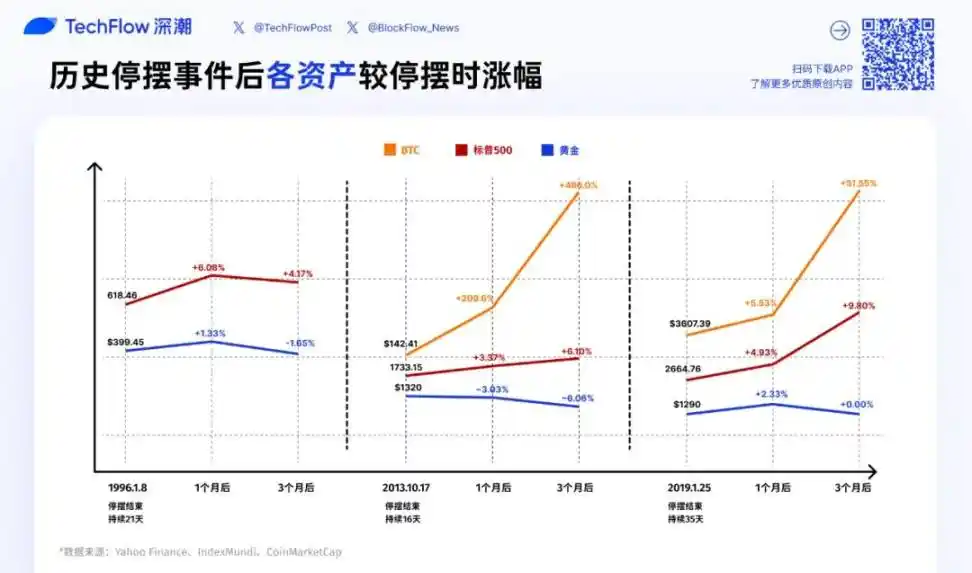
· 1 Month Later: S&P 500 rose to 656.07 (+6.1%), Nasdaq 1093.17 (+5.9%), Dow Jones 5539.45 (+6.6%);
· 3 Months Later: S&P 500 reported 644.24 (+4.2%), Nasdaq 1105.66 (+7.1%), Dow Jones 5594.37 (+7.6%);
This was more like a typical rise and then correction pattern. One month after the shutdown, all three major indices recorded around a 6% rebound, but the gains narrowed by the 3-month mark, with the S&P 500 even retracing from its 1-month high.
Though it was a long time ago, considering the political and economic environment at the time, the reason behind this could be that the market, after digesting the short-term positive impact of the shutdown resolution, returned to fundamental pricing.
The beginning of 1996 marked the start of the U.S. economic "Golden Age," with the emergence of personal computers and the internet in their infancy, tech development on the rise, mild inflation, and the market itself in a long-term uptrend, making the shutdown disturbance more of a side note.
2. October 2013 Shutdown (16 Days): U.S. Stocks Hit Pre-Financial Crisis High
On October 1, 2013, the Republicans attempted to use a shutdown to force a delay in the implementation of the Affordable Care Act by the Obama administration, resulting in another government shutdown. This shutdown lasted for 16 days, reaching an agreement only in the early hours of October 17.
Market Performance:
· 1 Month Later: S&P 500 rose to 1791.53 (+3.4%), Nasdaq 3949.07 (+2.2%), Dow Jones 15976.02 (+3.9%)
· 3 months later: S&P 500 reported 1838.7 (+6.1%), Nasdaq 4218.69 (+9.2%), Dow Jones 16417.01 (+6.8%)
This shutdown occurred at a special historical moment: October 2013 was the time when the U.S. stock market emerged from the shadow of the financial crisis and surpassed the 2007 high.
The end of the shutdown coincided almost simultaneously with a technical breakthrough, coupled with the QE3 quantitative easing implemented by the Federal Reserve at the time, and the market sentiment was extremely optimistic. Nasdaq saw an almost 10% increase within 3 months, significantly outperforming traditional blue-chip stocks, with tech stocks once again leading the rebound.
3. December 2018 Shutdown (35 Days): Bear Market Bottom Reversal, Strongest Shutdown Rebound
On December 22, 2018, Trump insisted on $5.7 billion for the U.S.-Mexico border wall fund, leading to a deadlock with the Democratic Party. This standoff persisted until January 25, 2019, setting the then-record for the longest shutdown in history (35 days), only to be surpassed by the current 42-day shutdown.
Market Performance:
· 1 month later: S&P 500 rose to 2796.11 (+4.9%), Nasdaq 7554.46 (+5.4%), Dow Jones 26091.95 (+5.5%)
· 3 months later: S&P 500 reported 2926.17 (+9.8%), Nasdaq 8102.01 (+13.1%), Dow Jones 26597.05 (+7.5%)
This was the strongest rebound of the three shutdowns, with special reasons behind it.
In the fourth quarter of 2018, U.S. stocks plummeted nearly 20% from their highs due to Fed rate hikes and trade tensions, hitting a temporary low on December 24.
The end of the shutdown almost synchronized with the market bottom, coupled with the Fed's subsequent policy shift to pause rate hikes, a double positive that likely drove a strong rebound.
Nasdaq's 13% increase in 3 months once again confirmed the high resilience of tech stocks in a risk appetite recovery phase.
Looking back at the historical data of U.S. stocks after a shutdown, three clear patterns emerge:

First, a short-term rebound is a high-probability event. In the month following the end of the three shutdowns, all three major indices without exception rose, with gains ranging from 2% to 7%. The elimination of uncertainty is itself a positive factor.
Secondly, tech stocks often outperform the market. The Nasdaq saw gains of 7.1%, 9.2%, and 13.1% over a 3-month period, significantly higher than the Dow Jones' 7.6%, 6.8%, and 7.5%.
Thirdly, the mid-term trend depends on the macro environment. There is a significant performance difference in the 1-3 months after the shutdown. Years such as 1996 with an initial rise followed by a correction, 2013 with a sustained rally, and 2019 with a strong rebound all had their own macro logic behind them, rather than the shutdown itself.
Gold Historical Review: Trends Not Solely Determined by the Shutdown
When we shift our focus to gold, we find a story that is quite different from the stock market.
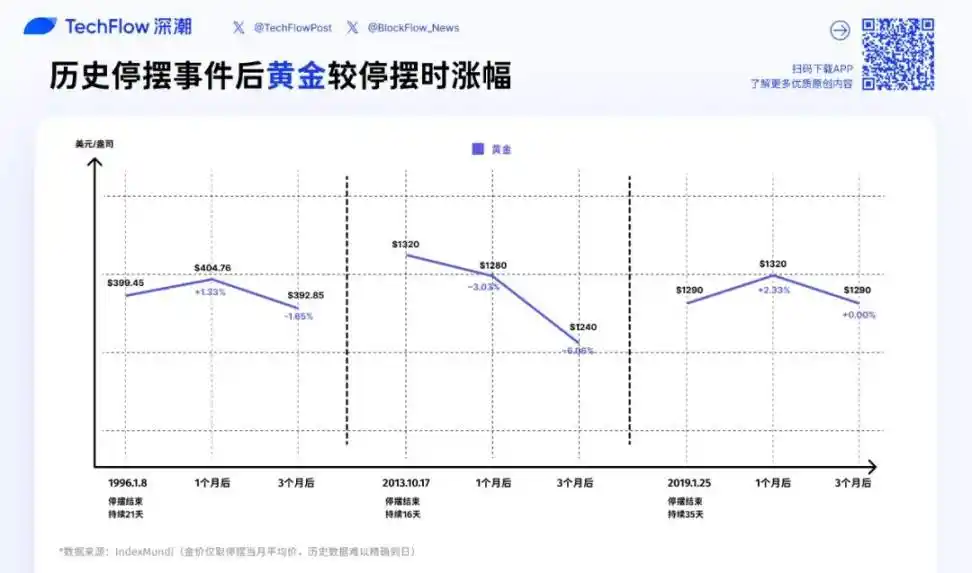
1. December 1995 Shutdown (21 Days): Minor Volatility
Gold Price Performance:
· End of Shutdown (January 1996): $399.45 per ounce
· 1 Month Later (February 1996): $404.76 (+1.3%)
· 3 Months Later (April 1996): $392.85 (-1.7%)
The impact of this political event on the price of gold was minimal.
2. October 2013 Shutdown (16 Days): Continued Pullback
Gold Price Performance:
· End of Shutdown (October 2013): $1320 per ounce
· 1 Month Later (November 2013): $1280 (-3.0%)
· 3 Months Later (January 2014): $1240 (-6.1%)
This was the weakest performance of gold among the three shutdowns. 2013 was a bearish year for gold, falling from $1700 at the beginning of the year to $1200 at the end, with an annual decline of over 25%.
The reason behind this was the Fed starting to discuss tapering quantitative easing, leading to a stronger dollar that suppressed the gold price. After the shutdown ended, as uncertainty faded, gold's safe-haven status further weakened, accelerating the price decline.
3. December 2018 Shutdown (35 Days): Initial Rise Followed by Retracement
Gold Price Performance:
· End of Shutdown (January 2019): $1290 per ounce
· 1 Month Later (February 2019): $1320 (+2.3%)
· 3 Months Later (April 2019): $1290 (0%)
During this shutdown, the US stock market experienced a sharp decline at the end of 2018, leading to a surge in safe-haven demand, driving the gold price up from $1230 to $1290. After the shutdown ended, the gold price briefly peaked at $1320. However, as the stock market rebounded and risk appetite increased, the gold price fell back to the level at the end of the shutdown, resulting in no net change over 3 months.
In the 2013 and 1996 shutdowns, the stock market rose by 3-6% after the shutdown ended, while gold either declined (2013: -6.1%) or traded sideways (1996: -1.7%).
This also aligns with the subjective perception that when uncertainty is eliminated and risk appetite returns, funds flow from safe-haven assets to risk assets.
If history repeats itself, after this 42-day shutdown, gold may face the following two scenarios:
Scenario One: Rapid Ebbing of Safe-Haven Demand. If the gold price has already risen during the shutdown due to safe-haven demand, the end of the shutdown may trigger profit-taking, causing a short-term pullback of 5-10%. This was most evident in the 2013 case.
Scenario Two: Unresolved Macroeconomic Risks. If the shutdown is over but macro concerns such as US fiscal issues, debt ceiling, economic recession risks persist, gold may remain strong or even continue to rise.
After all, the shutdown is only temporary.
From the current gold price perspective, the end of the shutdown may alleviate short-term safe-haven demand but is unlikely to change gold's long-term uptrend.
BTC Historical Retrospective: Limited Sample Size, Yet Revealing Insights
Finally, we come to the question that concerns crypto investors the most: How will Bitcoin perform after the shutdown?
Frankly, historical samples are extremely limited. Bitcoin did not exist during the 1996 shutdown, and in 2013, when there was a shutdown, Bitcoin's market cap was too small and it was in the midst of a super bull market. Therefore, the only truly relevant reference point is the shutdown of 2018-2019.
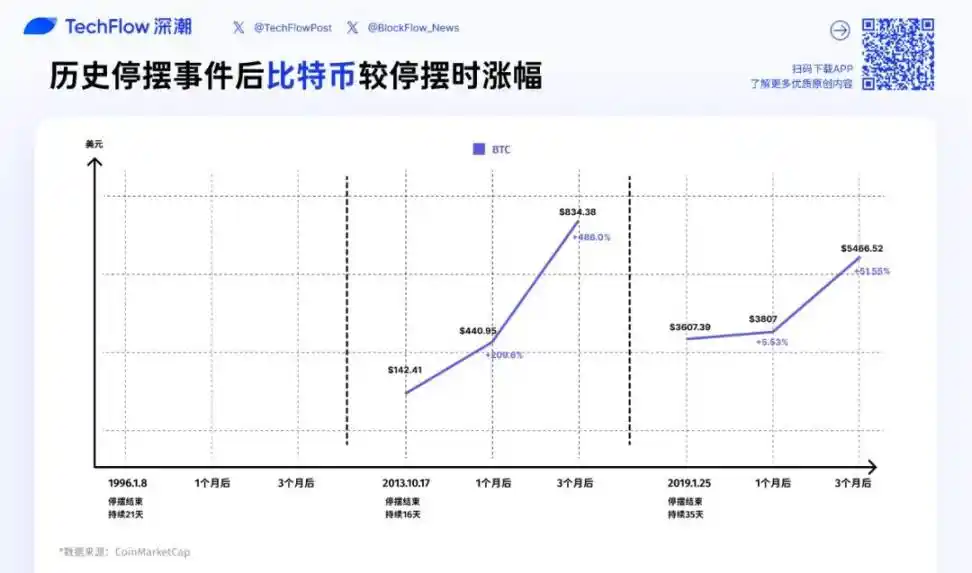
1. October 2013 Shutdown (16 days): Bull Market Interlude, Not Closely Related to the Shutdown
BTC Price Performance:
· End of Shutdown (2013-10-17): $142.41
· 1 Month Later: $440.95 (+209.6%)
· 3 Months Later: $834.48 (+485.9%)
This data looks extremely exaggerated, tripling in one month and nearly sextupling in three months.
2013 was one of the most insane bull market years in Bitcoin's history, with a skyrocketing over 5000% for the year, soaring from $13 at the beginning of the year to a peak of $1,147 by year-end.
October was right in the midst of this super bull market acceleration. BTC had just experienced a crash due to the FBI's seizure of the Silk Road, but the market quickly rebounded from brief panic to enter the craziest euphoric phase.
However, this shutdown had almost no causal relationship with BTC's trend. In Bitcoin's price logic, the government shutdown was more like a noise-level event.
2. December 2018 Shutdown (35 days): Bear Market Bottom, Key Turning Point
BTC Price Performance:
· End of Shutdown (2019-01-25): $3607.39
· 1 Month Later: $3807 (+5.5%)
· 3 Months Later: $5466.52 (+51.5%)
In December 2018, BTC was at the bottom of a prolonged bear market. From its high of $19,000 in December 2017, BTC had plummeted over 80%, hitting a temporary low of $3,122 on December 15, 2018. The start of the shutdown (December 22) was almost synchronous with BTC's bottoming out.
Within the first month after the shutdown ended, BTC only mildly rebounded by 5.5%, a gain far below the stock market's 4.9-5.5%;
But by the end of 3 months, BTC had surged by 51.5%, significantly outperforming the S&P 500's 9.8% and the Nasdaq's 13.1%.
There are several key factors behind this:
First, the bottom-reversal logic of BTC itself. In early 2019, the crypto market began to see a consensus that the "worst times were over": miners capitulated, retail investors exited, but institutions started to enter.
Second, an improvement in the macro environment. The Fed sent a dovish signal in early 2019, global liquidity expectations improved, which was positive for the high-risk asset BTC.
Third, BTC's market cap at the time was around $60 billion, much smaller than the stock market, with lower liquidity, hence higher volatility. When risk appetite rebounded, BTC's resilience naturally became stronger.
Comparing the performance with gold and the stock market, Bitcoin shows more of a macro Beta + its own cycle overlay result.
In the short term, BTC behaves like a high Beta risk asset.
After the shutdown, when uncertainty is removed and risk appetite recovers, BTC's rebound (12%) is close to Nasdaq's (5.4%) and far exceeds gold's (2.3%). This indicates that in a 1-3 month timeframe, BTC's pricing logic is closer to that of tech stocks rather than safe-haven assets.
However, in the medium to long term, BTC has its own cycle. After BTC rose to $5,200 in April 2019, it continued to rise to $13,800 in June, far exceeding any traditional asset. The core driver of this rally may come from the upcoming four-year halving cycle, with institutions and large companies entering the space.
Whether the government shuts down or not, the impact is minimal.
Looking ahead, if this 42-day shutdown ends, how will BTC react?
Short term (1-2 weeks): If the end of the shutdown triggers a "relief rally" in the U.S. stock market, BTC is likely to follow suit;
Medium term (1-3 months): It all depends on the macro environment. If the Fed remains accommodative, economic data remains decent, and there are no new political crises, BTC may continue its rally.
But don't forget, the crypto market currently lacks a breakthrough narrative, so expecting BTC's price to be primarily driven by internal factors is unlikely.
Shutdown Ends, Game Continues
The 42-day shutdown is about to end, but this is not the end; it's the beginning of a new round of market changes.
Looking back at history, the market usually experiences a short-term rebound after a shutdown ends. However, the sustainability of this rebound needs to be viewed rationally.
When you see the market rise by 5% after a halt, don't be quick to FOMO; when you see BTC experience a short-term pullback, don't panic sell either.
Stay rational, focus on the fundamentals, manage risk properly, and principles will not change just because of a halt.
Events can turn the page, but the game will continue.

Welcome to join the official BlockBeats community:
Telegram Subscription Group: https://t.me/theblockbeats
Telegram Discussion Group: https://t.me/BlockBeats_App
Official Twitter Account: https://twitter.com/BlockBeatsAsia